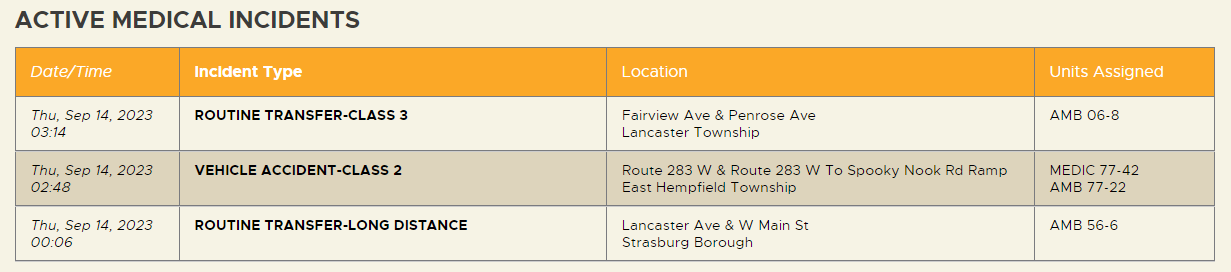
Earlier this year, I became interested in the LCWC (Lancaster County-Wide Communications) incident page - a county-wide dispatch system that provides incident updates for all of Lancaster County, PA.
It's very useful for residents to know what's going on with regards to various emergency services incidents. It's not without its flaws, however. For starters, downtime seems to be a big issue especially during peak incident periods which is less than ideal considering that's when most people are going to be slamming the site. Additionally, there doesn't seem to be any sort of historical data. I wanted to attempt to resolve those issues and also add some of my own, such as real-time notification systems and integrations with various social media platforms. This is where the rabbit hole begins.
Method #1 - Web Scraping
Initially, my goal was to simply scrape the web page itself, provided it was accessible considering the aforementioned frequent downtime. The downtime issue becomes even more apparent when you start polling it regularly, even at off-peak times. There was also another major issue with scraping - the lack of a static identifier for incidents. All incident details are subject to change except for the date/time (as far as I've been able to decern) but considering the lack of granularity with incident timestamps, there's nothing to prevent a conflict.
Method #2 - RSS Feed
Next I decided to look into the available RSS feed. Saviour of all our issues with no drawbacks whatsoever (foreshadowing is a literary device in which a writer gives an advance hint of what is to come later in the story). The RSS feed appears to be cached with a reasonably low TTL and doesn't seem subject to the pitfalls of the limited Drupal execution resources for the rest of the site. Additionally, it offers a GUID for each incident, which, while purely an RSS feed relic, does help us individualize incidents. Not all that glitters is gold however. The RSS feed is missing a critical component: incident categories. Unlike the webpage, the feed provides no indication of whether an incident is tagged as Fire, Medical, or Traffic. To resolve this, we essentially need a way to extrapolate what category an incident is based off of things like incident description and the units assigned, if there any even are. This requires us to have reliable references for each of the properties what they're correlated with, certainly doable with a fair degree of accuracy, but that requires a lot of data to use as a reference and still isn't 100% accurate.
An example RSS feed item:
<item>
<title>MEDICAL EMERGENCY</title>
<link>http://www.lcwc911.us/lcwc/lcwc/publiccad.asp</link>
<description>WEST COCALICO TOWNSHIP; SWAMP CHURCH RD & GALEN HALL RD; PENDING; </description>
<pubDate>Mon, 06 Nov 2023 13:35:26 GMT</pubDate>
<guid isPermaLink="false">d0fc384b-9468-4907-bfc5-e444864f5597</guid>
</item>
Method #3 - ESRI ArcGIS
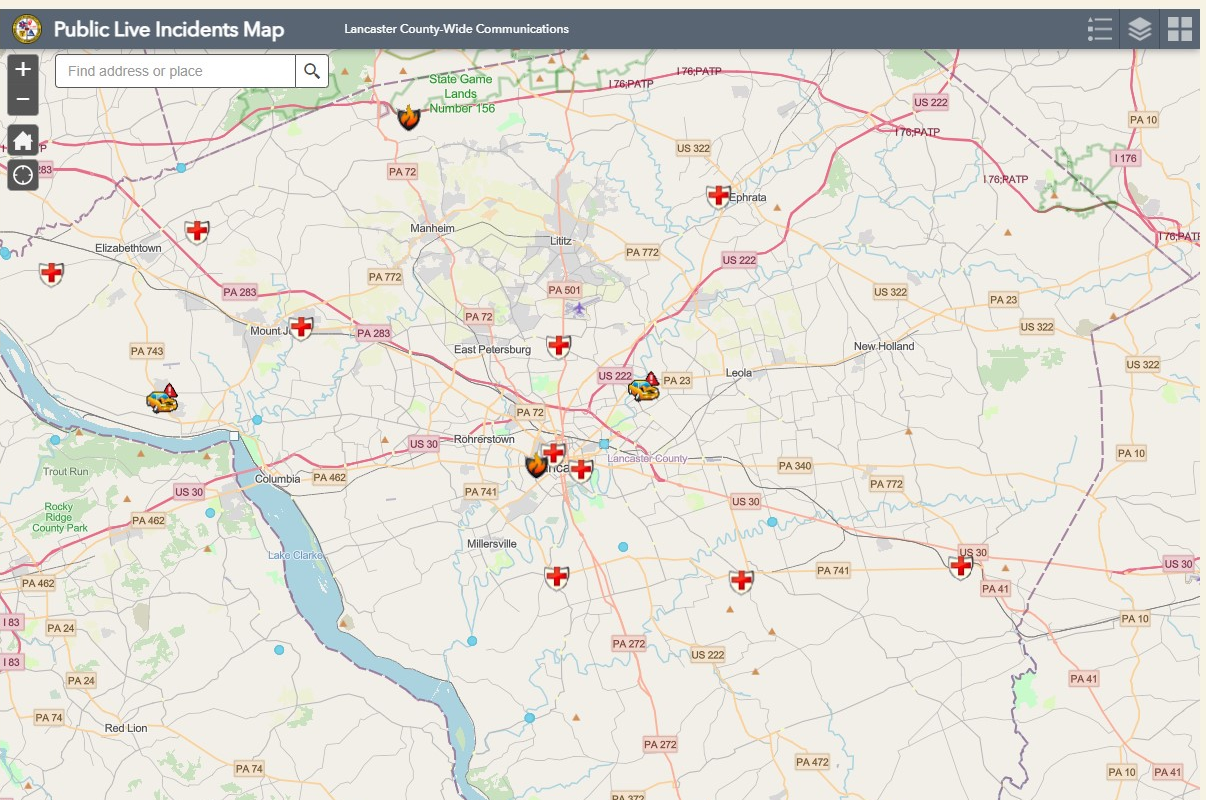
Around this time I realized there was more data out there, just in another format: the live incident map. It featured much more in-depth data on incidents that I've been able to access so far including incident numbers (which resolves the static identifier issue), priority codes, longitude/latitude, and agency. This was especially helpful because I was having to do my own geocoding based off of intersection/municipality which didn't necessarily indicate the exact coordinates of the incident and was especially troublesome if some of that data was missing form the incident listing, effectively making that impossible. The live map is based on an ESRI ArcGIS service which luckily provides a REST API, although it's not as straightforward as I would've liked when it comes to real-time information. This was my first foray into ESRI so everything was a learning experience.
Initially I thought it'd be as simple as just providing some geospatial coordinates for the county to get all the active incidents within those bounds, provided courtesy of the county GIS department (albeit in a different specification, but nice nonetheless). The first hurdle I ran into was actually requesting the incident data. Since the data is intended to be used in "layers" on the live map, each incident category has it's own endpoint and (as far as I know) no way to just lump them into a single request. So if we want Fire and Medical incidents, we have to make 2 separate requests. The second hurdle came from dealing with the caching mechanism ESRI utilizes. This makes sense when you're dealing with scalability and users commonly requesting the same data via the map interface, which is generally going to consist of relatively predictable geospatial coordinates. To bypass this, I initially added a bit of random "jitter" to the geospatial data - just enough to be (hopefully) unique, but not enough to impact the return dataset. This actually worked very well until I realized that the caching mechanism wasn't just based on known parameters, but ALL parameters. So the easier/more reliable method became appending the timestamp to each request. Gotta love the pre-mature over-engineering.
So now with this ESRI method everything should be good right? Nonsense. There's one small, but glaring issue: unit names. Both the web interface and RSS feed use fully-qualified unit names and the ESRI system uses a shorthand form for unit names. For identification sake, this isn't a big deal but the shorthand names aren't exactly intuitive for people, so a mapping system will likely need to be created to correlate the two such as MED865 to MEDIC 86-5. Some of them are intuitive, others are not.
Remaining Issues
Given the nature of how emergency response services work, there is some overlap with out-of-county units being dispatched to incidents if they're close to the incident at hand. This is a problem if we want to be able to identify what agency is handling said unit and we have no reliable way of doing so without knowing the other county's unit naming scheme and basically going through this whole process with neighbouring counties, which is a more than just a bit out of scope for this project.
I've basically opted to use the ESRI data as the source of truth as it's the most comprehensive with incident details. However, it does not seem to track stuff like transfers and standby statuses, as well as out-of-county incidents.
Future Plans
Living in the city, I'm rather accustomed to the sound of sirens whirring by. It's nice to know what might be going on around me or for family/friends that are high risk for medical emergencies. So I set out to create a proximity-based notification system for incidents in my area/around my family/friends. But first we need the data. Naturally there's no API handy so we get to do this ye old fashioned way.
I've been accumulating a lot of data. All the scraping functionality has been shoved into a Python package on PyPi for anybody to use. There is a REST API for querying active and historical incidents, as well as agency information. There is also a webhook service that will fire off updates to a Cloudflare Worker which formats the data into compatible formats for a variety of platforms such as Discord, Slack, Twitter, and more. If there's interest or boredom sets in one day, I might implement a websocket interface for real-time updates.
Privately, I've set up a notification service for both myself and friends/family so that if an incident occurs within a specified radius of their address, I will be notified. This has proven to be almost scarily accurate as not long ago I got a notification that there was a fire at my location yet I heard no alarms within my building. Looking outside, I saw a multiple fire response units at the building directly across the street from me. Perhaps a bit more granularity is needed.
Closing Thoughts
What started as a little weekend project turned into me deep-diving into a lot of different technologies and learning a lot of new things. I've learned a lot about ESRI and ArcGIS, which is a very powerful platform. I've also learned a lot about the county's emergency response system and how it works. A number of helpful people who work in the field have been kind enough to answer my questions and provide insight and empathize with their frustration with the current system. Throughout this I've learned that there is no real sense of standardization between county-level dispatch.
I'll probably continue to work on this project here and there and play with some data visualization like heatmaps and such. I'm also considering adding a feature to allow users to subscribe to incidents within a specified radius of an address, but that's for another day.
The API itself is open source, so technically anybody could host an instance, but I'd recommend just using the centralized instance when possible to avoid hammering the county's/ESRI's servers any more than necessary.
Example REST API response:
{
	"id": "6ac7e52c-977c-47aa-8654-c0daadf4c0b5",
	"category": "Medical",
	"description": "MEDICAL EMERGENCY",
	"intersection": "S PRINCE ST / W FARNUM ST",
	"municipality": "LANCASTER CITY",
	"dispatched_at": "2023-09-12T03:55:12+00:00",
	"number": 2309013581,
	"priority": 1,
	"agency": "LANCASTER EMS (LEMSA)",
	"coordinates": {
		"latitude": 40.03403523000003,
		"longitude": -76.30727306399996
	},
	"meta": {
		"added_at": "2023-09-12T04:04:10.661851",
		"updated_at": "2023-09-12T04:04:24.051156",
		"resolved_at": null,
		"client": "ArcGISClient v0.9.2",
		"automatically_resolved": false
	},
	"units": [{
		"id": "664422e6-4593-4ba6-9bd3-2bb5626bdad5",
		"name": null,
		"short_name": "INT",
		"added_at": "2023-09-12T04:04:24.095154",
		"removed_at": null,
		"last_seen": "2023-09-12T04:04:24.095154",
		"automatically_removed": false
	}, {
		"id": "823cdbdb-c15b-41f3-9015-55e7dc5ae1d6",
		"name": null,
		"short_name": "MED",
		"added_at": "2023-09-12T04:04:24.096157",
		"removed_at": null,
		"last_seen": "2023-09-12T04:04:24.096157",
		"automatically_removed": false
	}]
}
You can find the Python parser package on PyPi as well as on GitHub.
The API itself is also open source and can be found on GitHub as well and is additionally available on DockerHub.